


Innoflow Case Study How They Cut Onboarding Admin Time by 95 Percent
October 20, 2025
13 min
Transform your QBRs from a chaotic scramble into your most powerful strategic tool with a repeatable system designed to prove value and give you back your time.
Let’s be honest. For many Customer Success Managers, the acronym “QBR” triggers a mild sense of dread. It often means weeks of frantic data pulling, slide deck assembly, and last-minute coordination, all culminating in a high-stakes meeting that can feel more like a performance review than a strategic partnership session. But it doesn’t have to be this way.
The difference between a CSM who merely survives QBR season and one who thrives because of it isn’t raw talent or luck; it’s a system. A repeatable, scalable framework for QBR preparation transforms this quarterly ritual from a chaotic scramble into your most powerful strategic tool. It’s the engine that drives proactive engagement, proves undeniable value, and ultimately, gives you back your most valuable resource: time.
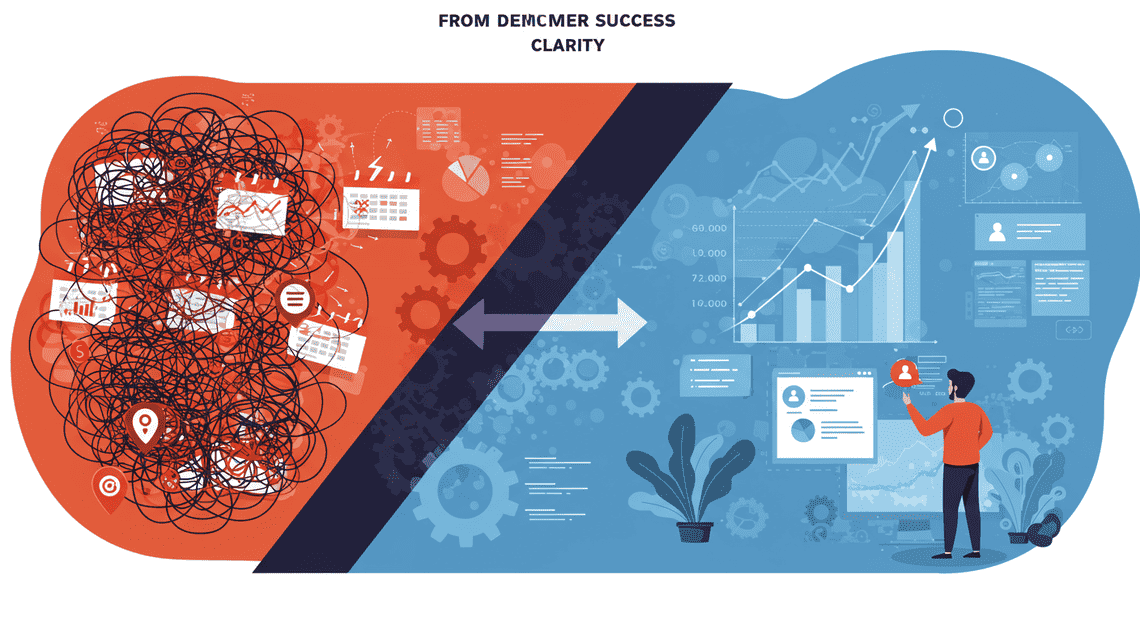
Without a system, QBR prep is a classic example of reactive work. The calendar alert pops up, and the fire drill begins. You dive into dashboards, export CSVs, and piece together a narrative from disparate data points. You become a data archeologist, digging for insights that should have been at your fingertips all along. The focus is on what happened, making you a historian of the past quarter.
A repeatable system flips the script entirely. It establishes a cadence of data collection and insight generation throughout the quarter. Instead of a last-minute scramble, you’re continuously curating the story.
Before the System: “What data can I find to show we did a good job?”
With a System: “Based on the trends we’ve tracked for 10 weeks, here is the strategic recommendation we need to present to drive their key objective next quarter.”
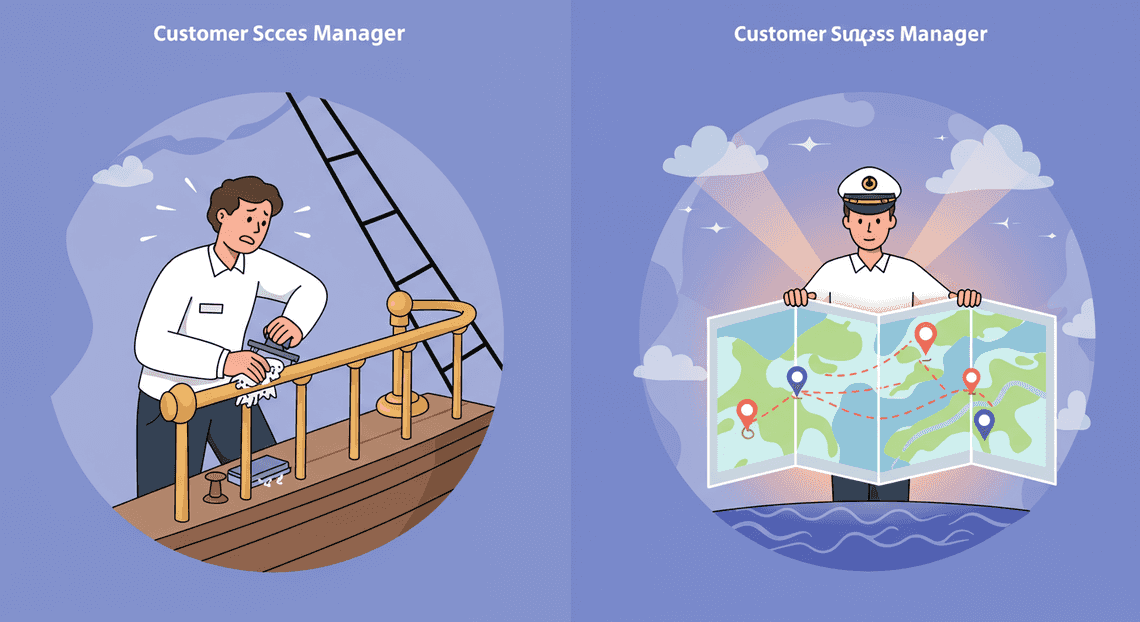
This shift is profound. You move from reporting on lagging indicators to influencing leading ones. The QBR becomes less of a backward-looking report and more of a forward-looking strategy session where you are the confident, trusted advisor steering the ship, not just the deckhand polishing the brass.
Churn rarely happens overnight. It’s the slow erosion of perceived value. A customer who doesn’t understand or remember the ROI you deliver is a customer at risk. One-off, heroically-prepared QBRs can sometimes land a punch, but they don’t build a defensive moat around your account. Consistency does.
A repeatable QBR system is your value demonstration engine. It forces a disciplined approach to connecting your product’s usage to the customer’s core business outcomes, every single quarter.
Standardized Metrics: You consistently track and present the metrics that matter most to their business, not just your product’s vanity metrics.
Narrative Continuity: Each QBR builds on the last, creating a clear, undeniable story of progress and partnership over time. You can point to the goal set in Q1, the actions taken in Q2, and the results delivered in Q3.
Stakeholder Alignment: The system ensures you’re communicating this value story not just to your day-to-day contact, but to the economic buyers and executive sponsors who sign the checks.
When a customer sees a consistent, data-backed narrative of success quarter after quarter, the renewal conversation becomes a formality. The value is self-evident. You’ve moved beyond “proving your worth” and into the realm of being an indispensable partner in their success.
The single biggest cost of a chaotic QBR process is the opportunity cost. Every hour you spend wrestling with a spreadsheet or formatting a slide is an hour you aren’t spending on what truly matters: building relationships, understanding your client’s evolving challenges, and uncovering expansion opportunities.
Implementing a repeatable system automates and streamlines the low-value, repetitive tasks of QBR prep. Think of it as building an assembly line for your presentation’s chassis—the core data, the standard slides, the basic structure. It’s pre-built. This frees up your cognitive bandwidth and your calendar for high-impact work.
With the time you reclaim, you can:
Engage in Proactive Outreach: Check in with users, share best practices, and offer support outside the formal QBR cycle.
Conduct Strategic Discovery: Have deeper conversations with key stakeholders to understand their shifting priorities for the next year, not just the next quarter.
Network Within the Account: Build relationships across different departments, identifying new use cases and opportunities for growth.
The system does the heavy lifting so you can do the heavy thinking. It transforms your role from a preparer of reports to a driver of outcomes, making you more effective, more strategic, and infinitely more valuable to your clients and your company.
A truly strategic Quarterly Business Review doesn’t just happen. It’s engineered. It’s the result of a deliberate, repeatable process that transforms a status update into a value-driven alignment session. Forget winging it with a few dashboards and a loose agenda. The most effective QBRs are built upon a foundation of four distinct, interconnected pillars. Mastering each one is the key to creating a framework that is both scalable for you and indispensable for your customer.
A QBR without data is just an opinion. This first pillar is about grounding your entire conversation in objective truth by collaboratively defining what success actually looks like. It’s about moving beyond vanity metrics and focusing on the numbers that tie directly to the customer’s business outcomes.
From Product Metrics to Business Value:
Your internal dashboards are full of metrics like Daily Active Users (DAU), feature adoption rates, and login frequency. While useful internally, these are often meaningless to a business executive. The first step is to translate your product’s metrics into the customer’s business language.
Leading Indicators: These are often your product usage metrics. They measure user behaviors that are predictive of future success. For example, the number of reports generated or workflows automated.
Lagging Indicators: These are the business results the customer cares about. They measure past success, such as ROI, cost savings, revenue generated, or risk mitigated.
A high-impact QBR connects the dots between these two. You must build the case that strong performance in leading indicators (our product usage) is directly driving the positive lagging indicators (their business results).
Collaborative Goal Setting:
Success criteria cannot be dictated; they must be co-created. This conversation should happen long before the QBR, ideally during onboarding and revisited each quarter. Ask probing questions to establish a shared definition of success:
“When you invested in our solution, what was the primary business objective you hoped to achieve?”
“How do you measure the success of that objective today, independent of our tool?”
“Looking ahead to the next 90 days, what would a ‘win’ look like for this specific goal?”
“What threshold would we need to hit for you to consider this a resounding success?”
The output of this pillar isn’t a dashboard; it’s a mutually agreed-upon scorecard that will serve as the foundation for the entire QBR.
With your key metrics defined, the next pillar is building a repeatable system to collect the necessary data. The goal here is efficiency and consistency. A last-minute scramble to pull numbers from ten different systems will inevitably lead to errors and a shallow analysis.
Create a QBR Data Checklist:
Don’t reinvent the wheel every quarter. Build a standardized template or checklist that outlines every data point you need to collect. This ensures nothing is missed and allows you to delegate or automate parts of the process over time. Your checklist should pull from multiple sources of truth:
Quantitative Data (The “What”):
Product Analytics Platform: Usage trends, feature adoption, user engagement levels.
CRM: Support ticket history, ticket resolution times, contract details, contact engagement.
BI Tools: Pre-built dashboards showing performance against the key metrics defined in Pillar 1.
Qualitative Data (The “Why”):
Previous QBR Notes & Action Items: What did you promise last time? Did you deliver?
Call Recordings (Gong, Chorus, etc.): What were the exact words the customer used to describe their challenges or goals in previous conversations?
Support & Services Interactions: What are the common friction points or questions coming from their team?
Internal Account Team Feedback: Insights from Sales, Support, or Product who have interacted with the account.
The “So What?” Test:
Data collection is not about volume; it’s about relevance. For every single chart, graph, or number you pull, you must relentlessly ask yourself: “So what?”
Data Point: “User logins are up 15% quarter-over-quarter.”
So What?: “This increased engagement across your team correlates with a 10% reduction in time spent on manual reporting, moving you closer to your operational efficiency goal.”
If you can’t connect a data point back to a customer goal or a key insight, it doesn’t belong in the QBR deck.
Data and metrics are the building blocks, but the narrative is the architecture. This pillar is about transforming your collected data into a coherent story that looks back, assesses the present, and charts a course for the future. A deck full of disconnected charts is confusing; a story is compelling.
Structure your QBR narrative around a simple, powerful arc:
This is the core of your data presentation. But instead of just showing graphs, present them as insights. Frame the data around “Wins,” “Challenges,” and “Opportunities.” Use clear, simple visuals. One key idea per slide.
Value-Based Language: Translate everything into business value.
Instead of: “You ran 300 reports this quarter.”
Try: “Your team’s analysis of 300 reports uncovered three key market trends, directly informing your new product strategy.”
This narrative structure turns your QBR from a report into a strategic consultation.
The final pillar ensures that the strategic conversation you’ve just had translates into tangible action. A brilliant QBR with a weak follow-up is a wasted opportunity. This pillar bookends the entire process, from setting expectations beforehand to ensuring accountability afterward.
The Pre-QBR Agenda:
A collaborative agenda is non-negotiable. It prevents surprises and ensures you’re discussing what matters most to the customer.
Send it in Advance: Send a draft agenda at least 3-5 business days before the meeting.
Make it Collaborative: Explicitly ask for their input. Use a phrase like, “Here is what we’ve prepared to discuss based on your goals. What’s top of mind for you that we should add to ensure this is a valuable use of your time?”
Time-Block Everything: Assign a time limit to each section. This keeps the conversation on track and respects everyone’s schedule.
The Post-QBR Follow-Up:
The meeting isn’t over when the video call ends. It’s over when you’ve sent a comprehensive follow-up email. This is your official record of the discussion and the contract for the next 90 days.
Send Within 24 Hours: Do it while the conversation is fresh in everyone’s minds.
Summarize Key Insights & Decisions: Briefly recap the main takeaways and any strategic decisions that were made.
List Action Items with a “Who, What, When”: This is the most critical component. Ambiguous action items never get done. Use a clear, accountable format:
[Owner Name] is responsible for [Specific Action] by [Due Date].
This pillar closes the loop, creating a virtuous cycle where the action items from one QBR become the “Accomplishments” you review at the start of the next one.
Theory is great, but execution is what separates a stressful, last-minute QBR scramble from a smooth, repeatable process. This is where we build the machine. We’re going to use a framework I call AC2F: The Automated Client Cycle Framework. It’s not a specific piece of software, but a methodology for orchestrating common tools—primarily the Google Workspace suite—to eliminate manual, repetitive work.
Let’s build your engine, step by step.
Your master template is the blueprint for every QBR you’ll ever conduct. Consistency starts here. Creating a robust template in Google Sheets (not Slides, yet!) is the critical first step because it allows us to separate data from presentation.
Your master sheet should be structured with distinct tabs, each serving a clear purpose:
README / Instructions: A brief guide for any team member on how to use this template. Include a checklist of the data points needed and where to find them.
Client Input: A clean tab where you can paste standardized client information. Think Client Name, QBR Date, Account Owner, Key Stakeholders, etc. Use named ranges for these cells (e.g., ClientName, QBRDate). This is crucial for How to Automate Invoices later.
Raw Data - Product: This is where you’ll pipe in quantitative product usage data. Set up columns for key metrics: Monthly Active Users, feature adoption rates, support tickets logged, etc. Keep it raw and unformatted.
Raw Data - Performance: This tab is for performance metrics tied to the client’s goals. If you’re a marketing agency, this could be leads generated, CPA, or ROAS. If you’re a SaaS platform, it might be workflow completions or time saved.
Analysis & Insights: Here’s where the magic happens. This tab pulls from the Raw Data tabs and transforms numbers into insights. Use formulas, pivot tables, and charts to visualize trends. Create sections for “Wins,” “Challenges,” and “Opportunities.” This is where you answer the “so what?” question.
Goal Tracking: A dedicated space to list the goals set in the previous QBR and track progress against them. A simple table with Goal, Target Metric, Actual Metric, and Status (On Track, At Risk, Achieved) works wonders.
Next Quarter Goals: A forward-looking tab to collaboratively outline and agree upon goals for the upcoming quarter.
Pro-Tip: Build your charts and key data callouts in the Analysis & Insights tab. When it’s time to build the presentation deck, you can simply copy and paste these as linked objects into Google Slides, ensuring your data is always in sync.
Once your blueprint is ready, you need a factory to produce the parts for each QBR cycle. Manually creating folders, copying files, and renaming them is a recipe for errors and wasted time. We automate this.
The goal is to have a script or a simple workflow that, upon receiving a client name and quarter (e.g., “Acme Corp - Q4 2024”), automatically generates a standardized How to add a folder in Google Drive structure.
Here’s what the ideal structure looks like:
/QBRs/Acme Corp/2024_Q4- 📄 [Acme Corp] QBR Prep Sheet - Q4 2024 (a copy of your Master Template)- презентация [Acme Corp] QBR Deck - Q4 2024 (a fresh copy of your presentation template)- 📁 Raw Exports (for CSVs, logs, etc.)- 📁 Meeting Notes (for internal prep and external follow-up)
How to achieve this:
Google Apps Script: This is the most powerful method. A simple script can be triggered from a master “QBR Tracker” sheet. You’d enter the client name and date, click a button, and the script creates the entire folder structure, copies the templates, and renames them with the correct client and quarter information.
Third-Party Tools: Services like Zapier or Make.com can create similar workflows. For example, a new row in a Google Sheet could trigger a “zap” that creates the folders and files in Google Drive.
Manual (but structured): If scripting isn’t an option, the bare minimum is to have a “TEMPLATE_QBR_CYCLE” folder that you manually duplicate and rename. It’s not automated, but it preserves the structural integrity.
The point of this step is zero-thought execution. A new QBR cycle kicks off, you run the automation, and your entire workspace is built perfectly in seconds.
Your engine now has a chassis, but it needs fuel. Data collection is often the most time-consuming part of QBR prep. The key is to create reliable, repeatable pipelines to get data into your newly created QBR Prep Sheet.
IMPORTRANGE: For data that already lives in other Google Sheets (like a master client health dashboard), use the IMPORTRANGE formula to pull it directly into your Raw Data tabs.
Connected Sheets: If your data lives in BigQuery, you can use Google’s Connected Sheets feature to query massive datasets directly from your Prep Sheet.
API Connectors/Middleware: Use tools like Supermetrics, Coefficient, or Zapier to connect your CRM (Salesforce, HubSpot), product analytics (Mixpanel, Amplitude), or advertising platforms directly to your Google Sheet. Schedule these to refresh daily or weekly.
This system ensures that by the time you sit down to work on the QBR, 80% of the necessary data is already waiting for you in the correct place. Your job shifts from data hunter to strategic analyst.
You’ve built individual engines for each client. Now you need an air traffic control tower. This is a single, master Google Sheet that serves as your QBR command center. It provides at-a-glance visibility into the status of every upcoming QBR across your entire book of business.
Your dashboard should include the following columns:
Client Name: The account.
Account Owner: Who is responsible.
Last QBR Date: When the last one occurred.
Next QBR Date: The target date for the upcoming one.
Prep Status: A dropdown menu with stages like Not Started, Data Collecting, Analysis in Progress, Deck in Review, Scheduled.
Link to QBR Folder: A direct hyperlink to the auto-generated Google Drive folder for that cycle.
Key Notes: A spot for high-level context (e.g., “Client has renewal in 60 days,” “Focus on expansion opportunity”).
Level up your dashboard with:
Conditional Formatting: Automatically color-code rows based on status. Scheduled is green, Data Collecting is yellow, and any QBR whose “Next QBR Date” is in the past is bright red.
Automated Reminders: Use Google Apps Script or a Zapier integration to send automated Slack or email reminders to the Account Owner when a QBR’s status hasn’t changed in a week or when the prep deadline is approaching.
This dashboard transforms QBR prep from a chaotic, siloed activity into a transparent, manageable process. As a manager, you can see everything in one place. As a CSM, you have a clear, prioritized list of what needs your attention.
All the meticulous preparation—the data aggregation, the slide creation, the internal alignment—culminates here. This is the moment of execution. A flawless QBR isn’t a performance; it’s a facilitated, strategic partnership meeting. Your goal is to shift the dynamic from a vendor reporting status to a strategic partner co-creating the future. This is where you transform data into dialogue, dialogue into decisions, and decisions into tangible forward momentum.
How you present your data is as important as the data itself. A confusing or overwhelming presentation can obscure even the most powerful insights. The objective is clarity and impact, not a data dump.
Lead with the Insight, Not the Chart: Never start by saying, “Here is a graph of your monthly active users.” Instead, lead with the conclusion. “We saw a 30% surge in adoption from your European team this quarter, which directly correlates to the new training program we launched. Let me show you what that looks like.” The insight is the headline; the data is the proof.
Embrace Visual Storytelling: Your deck should be a visual aid, not a teleprompter script. Use clean, simple charts and graphs that illustrate a single, powerful point per slide. Avoid dense tables and walls of text. Use callouts, arrows, and color to draw the eye immediately to the most critical takeaway. Structure your data points to tell a story:
The Past: Where were we? (Baseline from last QBR).
The Present: What did we accomplish? (Results and progress against goals).
The Future: What does this unlock? (The opportunity this progress creates).
Context is Everything: A metric in a vacuum is meaningless. Every data point you share must be contextualized. Is a 15% increase in usage good? It is if the goal was 10% and the industry benchmark is 5%. Compare data to previous quarters, established goals, business objectives, or relevant benchmarks. Always answer the implicit question: “Should I care about this number?”
Know Your Data, Cold: You must be the undisputed expert on every number you present. Be prepared to go two or three levels deeper. If a stakeholder asks why a specific metric dipped in the second month, a vague “We’ll look into it” erodes credibility. Have the details ready, or have them available in an appendix slide. This mastery demonstrates competence and builds trust.
The most common QBR failure is the “report-out”—a one-way monologue where you simply read through your slides. A successful QBR is a dialogue. You are there to facilitate a conversation that uncovers new challenges, validates priorities, and aligns your roadmap with their evolving business goals.
The 80/20 Rule of Dialogue: The customer should be doing 80% of the talking. You are not there to lecture; you are there to guide and listen. Use your slides as conversation starters, not a script. After presenting an insight, pause and ask a powerful, open-ended question.
Ask “Why” and “How,” Not Just “What”: Transform your presentation from a statement of facts into a series of strategic inquiries.
Instead of: “We completed Project X.”
Try: “Now that Project X is complete, how is this impacting your team’s workflow? What new opportunities does this open up for you in the next six months?”
Instead of: “Here’s your usage data.”
Try: “We noticed a surprising trend in this usage data. Why do you think that’s happening? How can we leverage that behavior?”
Be a Navigator, Not a Tour Guide: The agenda is your map, but the customer’s priorities are the destination. If they latch onto a topic and want to dive deep, let them. A 20-minute unplanned discussion on a key challenge is infinitely more valuable than rigidly sticking to your allotted 5 minutes. The goal is to uncover what truly matters to them right now.
Listen for Business Outcomes: Pay close attention to the language your customer uses. Are they talking about “reducing operational overhead,” “mitigating compliance risk,” “accelerating time-to-market,” or “improving customer satisfaction”? These are their core business drivers. Every time you hear one, your job is to connect your product, service, and data back to that specific outcome.
A QBR without clear outcomes and a follow-up plan is just a conversation. The value is realized in the actions taken after everyone leaves the room. This requires a rigorous commitment to documentation and accountability.
Capture Action Items with the “Who, What, When” Framework: During the meeting, explicitly capture every commitment made. Don’t move on from a topic until the action item is clarified. For each one, define:
Who: Assign a single, named owner. “The engineering team” is not an owner; “Sarah from engineering” is.
What: Define the specific, tangible deliverable. “Investigate the API issue” is vague. “Provide a root cause analysis document for the API latency issue” is specific.
When: Set a clear and realistic due date.
Recap and Confirm Before You Adjourn: Dedicate the final five minutes of the meeting to a verbal recap of the decisions and action items. Go through the list one by one: “To confirm, my team, led by John, will deliver the draft of the new onboarding plan by EOD Friday. Your team, led by Maria, will provide feedback by next Wednesday. Do we all agree?” This simple step eliminates ambiguity and ensures everyone leaves with the same understanding.
Send a Prompt and Professional Summary: Within 24 hours, send a follow-up email to all attendees. This is non-negotiable. It serves as the official record of the meeting and the starting pistol for all follow-through. It should include:
A brief thank you and acknowledgment of their time and partnership.
A high-level summary of the key strategic themes discussed.
A clear, bulleted list of the “Who, What, When” action items.
A link to the presentation deck and any other resources discussed.
The frantic, late-night scramble before a Quarterly Business Review is a rite of passage for many in customer success and account management. It’s a chaotic ballet of pulling reports, wrangling spreadsheets, and hastily assembling slides, often culminating in a presentation that’s more of a data dump than a strategic conversation. This reactive cycle is exhausting, inefficient, and, most importantly, it fails to deliver the value your customers deserve.
The shift from a reactive preparer to a proactive strategist doesn’t happen by accident. It requires a fundamental change in your process—a move away from ad-hoc efforts and toward a repeatable, scalable system. It’s time to trade last-minute panic for forward-thinking partnership.
Throughout this guide, we’ve detailed a system designed to reclaim your time and elevate your client conversations. An automated, repeatable framework isn’t just about efficiency; it’s about transforming the very nature of your QBRs. Let’s briefly recap the core benefits:
Drastic Time Savings: By automating data collection and standardizing your narrative structure, you eliminate hours—or even days—of manual, low-value work. This is time you can reinvest in high-level strategy and customer engagement.
Unwavering Consistency: Your customers receive a consistently high-quality, professional experience every quarter, regardless of which team member is leading the review. This builds brand trust and predictability.
From Data to Story: The framework forces you to move beyond isolated metrics. It connects the dots between product usage, achieved outcomes, and future goals, helping you tell a compelling, data-driven story of value and partnership.
Proactive Insight Generation: When you’re not bogged down in preparation, you have the mental space to analyze trends, identify risks, and uncover expansion opportunities before the meeting, not during it.
Scalable Excellence: As your book of business grows, a repeatable system ensures your QBR quality doesn’t suffer. You can manage more strategic accounts more effectively without burning out.
Knowledge without action is just trivia. You’ve seen the blueprint for a better QBR; now it’s time to build it. The AC2F (Align, Collect, Create, Follow-up) framework is your tool for turning this concept into a reality within your own workflow.
Don’t try to boil the ocean. The path to a fully repeatable system is paved with small, deliberate steps. Here’s how to start:
Select One Pilot Account: Choose one upcoming QBR for a key customer. Commit to using the AC2F framework exclusively for this preparation. This focused approach makes the initial learning curve manageable.
Block “Strategy Time”: The time you save on manual data pulling is your new “Strategy Time.” Schedule it on your calendar. Use this block to think critically about the customer’s goals, review the insights your system has generated, and craft the strategic narrative for the meeting.
Iterate and Refine: Your first run-through won’t be perfect, and that’s okay. After the QBR, conduct a personal post-mortem. What worked well with the AC2F process? Where were the friction points? Refine your templates and automation rules based on your experience.
By taking this first step, you initiate a powerful flywheel. Each QBR becomes easier, faster, and more strategic than the last. You stop being a vendor who reports on the past and become an indispensable partner who helps shape the future. The scrambling stops here. The strategy starts now.
Quick Links
Legal Stuff